Manual dashboards are a productivity killer. Pulling data, updating spreadsheets, and chasing metrics eats up hours that could be spent making smarter decisions. The solution? Performance reporting tools that automate the heavy lifting, give you real-time insights, and let your team focus on action, not admin. In this guide, we’ll break down 21 of the best tools to replace manual dashboards, helping you save time, reduce errors, and turn data into decisions that actually drive results.
To help with that, AI Acquisition's AI automation software brings reporting automation, real time analytics, KPI tracking, and clean data visualization together so your sales leaders see the metrics they need without extra work.
Summary
Manual reporting breaks under scale, with 85% of businesses saying traditional methods are too slow to meet their needs, a lag that turns tactical fixes into missed monthly revenue and stalled pipeline velocity.
Traditional dashboards often lack context; 70% of organizations report that conventional reports do not provide actionable insights, so numeric alerts more often raise questions than drive decisions.
Investing in performance reporting tools changes outcomes, as over 80% of businesses report improved decision-making, and companies using these tools see roughly a 30% increase in productivity.
Prioritize a small set of leading KPIs, typically three to five signals, and you get clearer tradeoffs and faster learning; 70% of companies that implemented performance management tools reported improved employee engagement.
Automating data ingestion and verification can reduce reporting cycles from days to hours and enable 24/7 monitoring, reducing false alarms caused by hourly exports and fragile manual pipelines.
Match cadence to decision speed by using five-minute morning checks and 30-minute weekly syncs, and run short, role-specific workshops such as a 90-minute playbook session that moved a six-person team to scripted follow-ups within two weeks.
AI Acquisition's AI automation software addresses this by automating data ingestion, real-time KPI verification, and linking automated agent activity to revenue signals, enabling teams to compress reporting cycles and turn dashboards into repeatable actions.
Table of Content
How to Implement and Get the Most From Your Performance Reporting Tools
Turn Insights Into Action with AI Acquisition’s Growth Consultant
Why Aren't Traditional Reporting Methods Enough?

Manual reporting and basic spreadsheets look tidy until they stop telling you why numbers move. They work for small experiments, but they break under real-world complexity:
Slow updates
Hidden errors
A blind spot around customer intent that turns confident decisions into guesses.
Why Are Spreadsheets So Fragile Here?
Human error is the obvious leak. During a three-month audit of a small agency’s reporting process, a single undocumented change removed a runtime dependency, causing a short-lived outage that knocked out VoIP for hours because the software inventory was stored in a shared spreadsheet.
That kind of outage is not rare; it is predictable when your system of record depends on:
Manual entry
Fragile formulas
A single person’s memory
What Does Slow Reporting Actually Cost You?
According to Dot Analytics, 85% of businesses report that traditional reporting methods are too slow to meet their needs. This lag turns tactical fixes into strategic crises, because teams discover problems after the window to act has closed.
That delay results in:
Missed monthly revenue
Stalled pipeline velocity
Frantic resource shuffles
People are reallocating time instead of growing top-line results.
Why Do Traditional Reports Leave You Hanging?
Because a raw metric without context is a riddle. Dot Analytics: 70% of organizations find that traditional reports do not provide actionable insights, which is why dashboards often prompt more questions than drive decisions.
A conversion dip looks like failure until a session replay or a short user interview shows:
A confusing call to action
A misrouted form
A pricing expectation mismatch
Without qualitative signals, your numeric alerts point to symptoms, not causes.
How Does This Actually Break Teams And Outcomes?
When reports arrive slowly and lack context, decision cycles expand. Marketing shifts the budget a week too late. Sales teams chase bad leads because acquisition cost calculations are stale.
Operations were overstaffed for a perceived peak that was a tracking artifact. These are not theoretical losses; they are the everyday fatigue of teams that must babysit spreadsheets instead of improving customer journeys.
What Should Better Reporting Include?
Combine real-time dashboards with voice-of-customer sources:
Targeted surveys
Interview summaries tied to the same KPIs
Think of dashboards as maps and qualitative inputs as field notes that explain the terrain. That pairing turns a number into a narrative, so you can prioritize fixes that:
Raise monthly revenue
Reduce manual workload
Make lead-to-call conversions repeatable
The Familiarity Trap: Why Low-Friction Now Means High-Cost Later
Most teams handle reporting the old way because it is familiar and low-friction. That familiarity works early on, but as data sources and decision velocity increase, manual processes lead to fragmentation, hidden errors, and slower reaction times.
Platforms like AI Acquisition provide:
Prebuilt connectors
Automated ingestion
Real-time verification dashboards that link automated agent activity to revenue signals
It reduces reporting cycles from days to hours and making 24/7 AI teams auditable and optimizable for nontechnical founders.
How Do You Avoid Overfitting To Vanity Metrics?
Use reports that prioritize impact, not volume. Start with a small set of business-focused KPIs, enrich them with customer voice, then automate alerts for deviations tied to a hypothesis and a next step. That pattern keeps your team focused on actions that drive outcomes, not on trends that appear important on paper.
The Decision-Certainty Gap: Moving from “Gut” to “Verified”
We all feel the exhaustion when a Monday meeting surfaces a surprise number, and no one knows why. That pressure disappears when reporting becomes a verification layer rather than an afterthought.
But the real test is how reporting turns noise into predictable action, and that’s where the next part gets interesting.
Related Reading
21 Performance Reporting Tools That Turn Data into Action
Choosing the right performance reporting tool feels like standing in a tool shop with every drawer open; the wrong pick wastes time, the right one turns data into reliable action. To truly scale, many modern founders are bypassing manual setups entirely by using AI automation software to handle both data generation and reporting in a single workflow.
This curated list sorts the noise into clear categories so you can quickly and decisively match needs to capabilities.
Outcomes Over Outputs: The Productivity Premium of Modern Reporting
According to Contentsquare, more than 80% of businesses report that using performance reporting tools has improved their decision-making. Investing in reporting changes how teams decide.
And Teamwork Blog reports that companies that use performance reporting tools see a 30% increase in productivity, which is why the tool you choose should be judged by the outcomes it delivers, not the feature list.
1. AI Acquisition: AI Automation Platform

Key features:
Multi-agent no-code platform that automates:
Lead generation
Sales outreach
Back-office workflows
Best use case:
Solo founders and small agencies that need 24/7 pipeline activity without hiring large teams.
Differentiator:
AI Acquistion is built as an agentic operating system that ties automated actions directly to revenue signals and predictable lead-to-call conversions.
2. Tableau: Data Visualization Software
Key features:
Drag-and-drop Prep Builder
AI-powered Pulse for natural language queries
Deep visualization library.
Best use case:
Marketing and sales teams that need expressive dashboards to communicate complex trends.
Differentiator:
Strong visual storytelling and Salesforce integration for close alignment between campaigns and pipeline.
3. Whatagraph: Marketing Analytics

Key features:
Connects 50+ marketing platforms
Merges multi-channel data
Refreshes every 30 minutes
Best use case:
Agencies and in-house marketers who report campaign performance to stakeholders or clients.
Differentiator:
Fast, client-ready reporting that minimizes back-and-forth during monthly reviews.
4. Zoho Analytics: Business Analytics Platform
Key features:
Charts
Pivot tables
Predictive analysis
500+ connectors
Best use case:
Data-heavy teams that want self-serve analytics without expensive BI teams.
Differentiator:
Balances rich analytics with affordable pricing and natural language queries via AI assistant.
5. Coupler.io: Data Integration Tool
Key features:
Scheduled pulls into Sheets
Warehouses, or BI tools
15-minute refresh option
Multiple dashboard templates
Best use case:
Teams that stitch data from multiple SaaS tools into a single reporting sink.
Differentiator:
Simple, low-friction ETL for non-technical users who need near-real-time reports.
6. Google Analytics: Web Analytics Service

Key features:
User acquisition
Monetization reporting
Real-time traffic monitoring
Best use case:
Product and growth teams tracking user journeys and SEO impact.
Differentiator:
Ubiquitous, free baseline for web metrics that integrates into most marketing stacks.
7. Domo: Business Intelligence Platform
Key features:
Live visualizations
Automated reporting
AI summarization
Fraud pattern detection
Best use case:
Mid-market teams that need consolidated dashboards across many data sources.
Differentiator:
Enterprise-style automation that simplifies sharing executive summaries.
8. Salesforce: CRM and Reporting
Key features:
Custom reports
Drag-and-drop report builder
Joined report views
Best use case:
Sales and content teams tracking engagement to revenue outcomes.
Differentiator:
Tight CRM-to-reporting flow, ideal when sales activities must directly map to pipeline metrics.
9. HubSpot: CRM and Marketing Reporting
Key features:
Unified CRM-to-marketing dashboards
Templated dashboards
Secure sharing controls
Best use case:
Small to mid-size marketing teams need integrated campaign-to-revenue visibility.
Differentiator:
Low-effort setup for cross-functional reporting across:
Marketing
Sales
Service
10. Cometly: Advertising Analytics Tool
Key features:
Hourly ad data updates
Multi-platform ad aggregation
Audience action details
Best use case:
Performance marketers who need fast iteration on ad spend.
Differentiator:
Hourly refresh cadence that supports rapid bid and creative testing cycles.
11. Explo: Embedded Analytics Platform
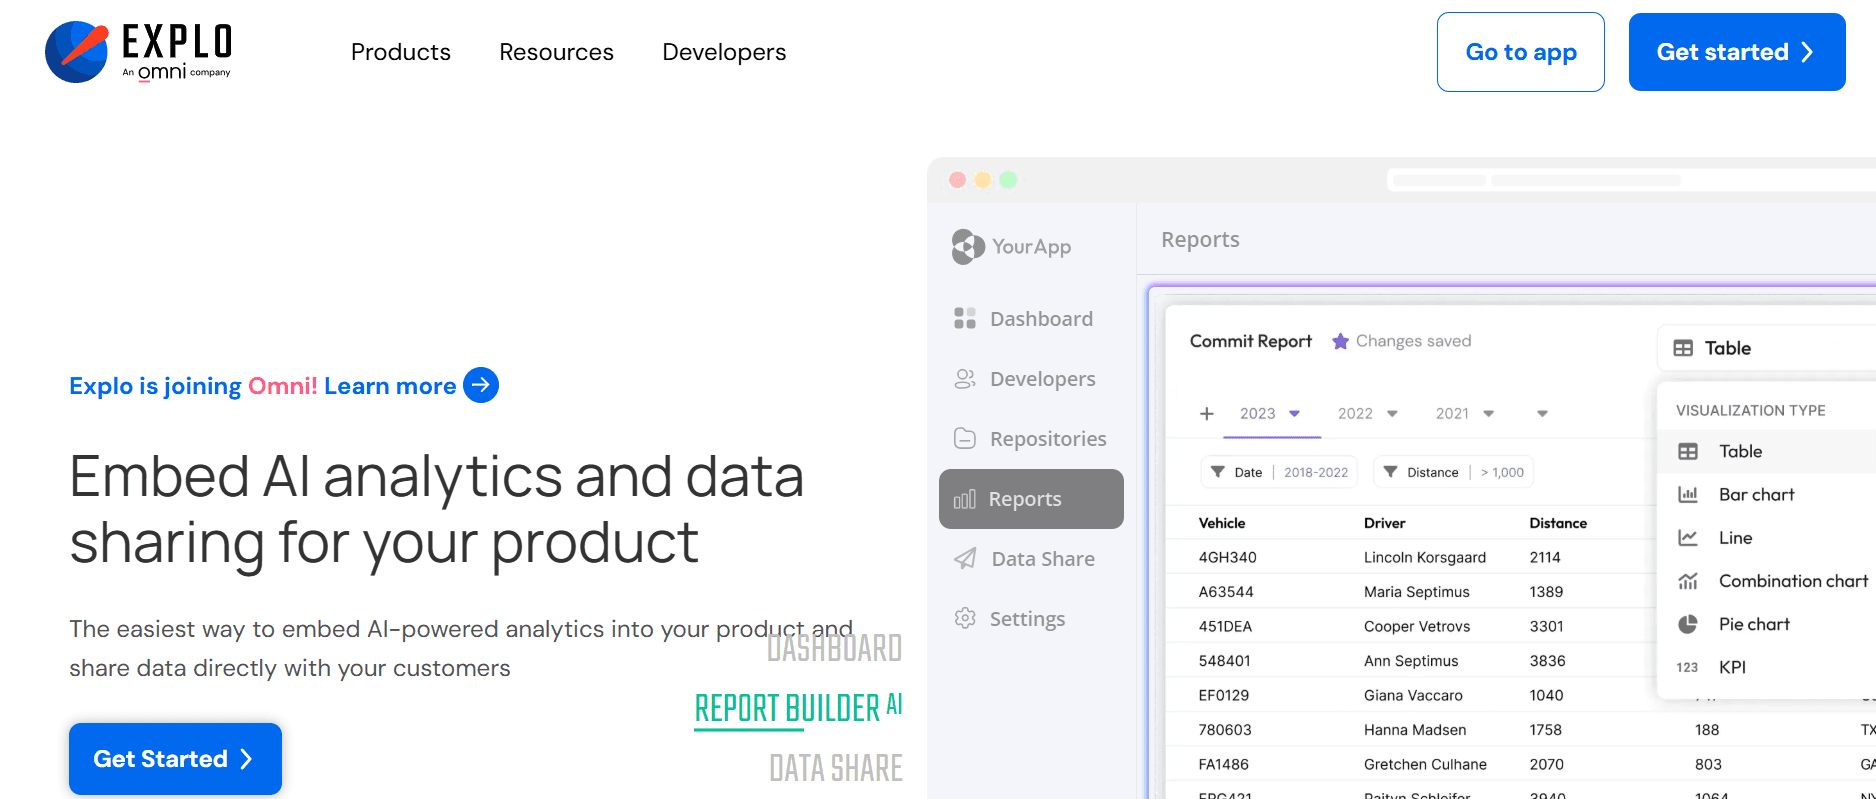
Key features:
White-labeled dashboards
Real-time KPIs from live databases
Multi-tenant access control
Best use case:
SaaS companies that want to offer customers embedded analytics.
Differentiator:
Combines no-code dashboards with SQL precision for client-facing metrics. For those looking to build these capabilities internally, leveraging AI automation software can significantly speed up the data-to-dashboard pipeline.
12. Klipfolio: Dashboard Software
Key features:
100+ integrations
Drag-and-drop dashboards
Embeddable visuals
White-label options
Best use case:
Agencies delivering recurring KPI reports to clients.
Differentiator:
Good balance of:
Affordability
Customization
Live monitoring for SMBs
13. Databox: Mobile-First KPI Reporting

Key features:
Mobile dashboards
Datablocks for quick widgets
Automated alerts and goal tracking
Best use case:
Teams that need on-the-go visibility and daily performance check-ins.
Differentiator:
Mobile-first UX that keeps distributed teams aligned without clunky desktop dashboards.
14. Google Looker Studio: Free Reporting Tool

Key features:
Multi-source connectors
Interactive
Shareable reports
Zero licensing cost
Best use case:
Startups and small teams are already in the Google ecosystem.
Differentiator:
Free, flexible reporting with strong Google product integration.
15. Power BI: Enterprise BI
Key features:
Deep data modeling with:
DAX
Enterprise connectors
Real-time dashboards
Best use case:
Large organizations that require complex analytics and alignment with the Microsoft ecosystem.
Differentiator:
Advanced modeling and scale for teams that need heavy data transformation.
16. Zoho Analytics (repeat): Analytics Platform (alternate angle)
Key features:
Role-based access
AI assistant Zia for insights
Collaborative dashboards
Best use case:
SMBs that need secure, shared analytics across roles.
Differentiator:
Role controls plus AI-guided insight discovery for non-analysts.
17. Geckoboard: KPI Dashboard Tool
Key features:
Fast setup
Clean TV dashboards
No-code integrations
Best use case:
Small teams want visible, at-a-glance performance on shared screens.
Differentiator:
Focused simplicity for real-time display without analysis overhead.
18. Ahrefs: SEO Performance Platform

Key features:
Site Explorer
Backlink data
Organic traffic estimates
Competitor reports
Best use case:
SEO and content teams are tracking search visibility and competitor moves.
Differentiator:
Competitive intelligence that plugs directly into content and growth reporting.
19. Segment: Customer Data Platform
Key features:
Centralizes event and user data, routes to analytics and marketing tools.
Best use case:
Product and growth teams are consolidating product telemetry for reporting.
Differentiator:
Reduces integration friction by delivering consistent identity and event data across tools.
20. Supermetrics: Data Integration Platform

Key features:
Connects 100+ marketing and analytics sources, sends to Sheets, BigQuery, and BI tools.
Best use case:
Marketing teams building repeatable reporting pipelines into familiar docs and BI.
Differentiator:
Fast path for marketers to move raw metrics into reporting surfaces without engineering time.
21. Analytics Canvas: Analytics Connector & ETL
Key features:
GA4-focused extracts
Workflow automation
Drag-and-drop ETL builder
Best use case:
Teams that automate GA4 exports and pre-process data for BI tools.
Differentiator:
Workflow-driven approach for repeatable data prep and scheduled publishing.
Collapsing the Audit Gap: Real-Time Revenue Verification
Most teams start by cobbling together a few best-of-breed tools because each solves something immediate, and that makes sense when you are small. As complexity grows, however, the hidden cost manifests as duplicate connectors, mismatched identities, and long debugging cycles that eat time and blunt iteration.
Platforms like AI Acquisition offer a different approach, combining agentic automation with built-in verification dashboards, enabling teams to trace automated actions to revenue and compress review cycles from days to hours while maintaining auditability.
Reverse-Engineering Your Stack: Matching Tools to Quarterly Truths
Start with the question, what outcome matters this quarter, not which feature looks coolest. If your priority is faster decision-making cycles, choose a tool with live refresh and alerts. If you need auditability for external customers, pick an embedded analytics option.
If you want to reduce headcount friction, prefer platforms that include connectors and prebuilt mappings so you can focus on hypotheses, not glue.
From Adoption to Attribution: Hardwiring AI into Your Core Stack
When entrepreneurs layered automated agents into their sales process, those who paired activity with clear reporting saw predictable pipeline growth, with measurable results within three months; that clarity is the difference between busy work and scalable revenue operations.
Choose based on goals, team size, and workflows, not hype, so your next step is about adoption and outcomes, not another tool to manage. That change helps, but the harder question is how you actually make these tools stick and drive measurable revenue, which is exactly why integrating AI automation software into your core stack is becoming the standard for modern growth.
That change helps, but the harder question is how you actually make these tools stick and drive measurable revenue.
Related Reading
How to Implement and Get the Most From Your Performance Reporting Tools

Begin by naming the outcomes you want to change, then lock those outcomes to:
Automate the data flow
Run a short cadence of reviews
Teach the team exactly what to do when a metric moves
Do those five things in that order, and reporting stops being busywork and starts being a playbook you can trust.
Which KPIs should you pick and why?
Pick a small set of leading indicators that directly move revenue and capacity, not vanity metrics that feel important.
I recommend three to five signals:
Lead-to-call conversion
Time-to-first-contact
Average deal size
A simple health metric for agent throughput
This focus makes tradeoffs visible, so when you change an outreach script or an offer, you see whether pipeline velocity or capacity changed first, not sometime later.
How Do You Automate Data Collection Without Breaking Trust?
Start with a source-of-truth plan:
Map each KPI to a single canonical field
Give it a consumer and an owner
Wire repeatable connectors and automated tests
Expect friction: we audited a client and found that their “real-time” dashboard was actually an hourly export, which generated false alarms during rapid experiments. Automating collection and verification matters is important because, in 2025, Folks found that organizations using performance reporting tools saw a 30% increase in productivity.
How Should Review Meetings And Dashboards Be Scheduled?
Match cadence to decision speed. For daily decisions, use a five-minute morning check focused on anomalies and actions. For weekly tactical shifts, hold a 30-minute sync with owners who own a single KPI.
Dashboards should be action-first:
Show the deviation
The likely cause
The hypothesis
The owner
Think of a dashboard like a cockpit panel, not a museum placard, where every alert should point to a lever you can pull.
How Do You Train Teams To Interpret And Act On The Data?
Run short, role-specific workshops that end with live rehearsals:
Give a dashboard alert
Ask the team to name the hypothesis
Choose the action
Record the expected outcome
When we ran a 90-minute playbook session with a six-person sales team, they moved from guessing next steps to executing scripted follow-ups within two weeks. That behavioral shift is why, in 2025, Folks reported that 70% of companies that implemented performance management tools reported improved employee engagement.
Why Workflow Stitching Stalls Scale
Most teams do this in the familiar way, by stitching manual checks into existing workflows because it feels low effort. As soon as data sources and decisions multiply, that habit creates invisible rework, missed experiments, and reluctance to trust automation.
Solutions such as AI Acquisition, which coordinate multi-agent activity with:
Verification dashboards
Offer an alternative path
Centralizing event tracing
Automated mapping
Role-based visibility
Owners can focus on running experiments rather than reconciling numbers.
How Do You Choose The Right Tool For Adoption And Optimization?
Decide by constraint. If you are a solo founder, prioritize no-code connectors and templated KPIs to deliver value without an engineer. If you run a distributed sales team, prioritize low-latency feeds and clear ownership controls.
If compliance is a priority, prioritize audit trails and role-based permissions. In every case, prefer tools that let you start small, prove an experiment in 30 days, then scale the same patterns without rewriting connectors.
It feels like the reporting problem is solved, but the part that actually forces change is the human side, the moment a team must act under pressure, and the data either guides them or leaves them frozen.
Turn Insights Into Action with AI Acquisition’s Growth Consultant
Tracking KPIs is only half the battle; you need an engine that turns performance reporting tools and dashboard signals into repeatable outreach and pipeline actions. Knowing your metrics is only half the battle.
AI Acquisition helps you take the insights from performance reporting tools and turn them into real business growth, automatically.
Let our AI Growth Consultant:
Analyze your KPIs
Identify opportunities
Generate leads 24/7
Automate:
Follow-ups
Book meetings
Manage pipeline tasks without extra staff
Make data-driven decisions actionable, so reporting dashboards don’t just sit on the screen
Whether you’re tracking sales, marketing, or operational performance, our AI agents help you move from numbers to results while saving time and reducing guesswork. Get access to your free AI growth consultant today and see how actionable reporting can drive measurable growth.
Related Reading
AI Sales Prospecting Tools
AI Tools For B2B Marketing
AI For Sales Calls
Lead Qualification Strategies


